 Did you know how to show variables in Debugger using a tree structure?
 |
|
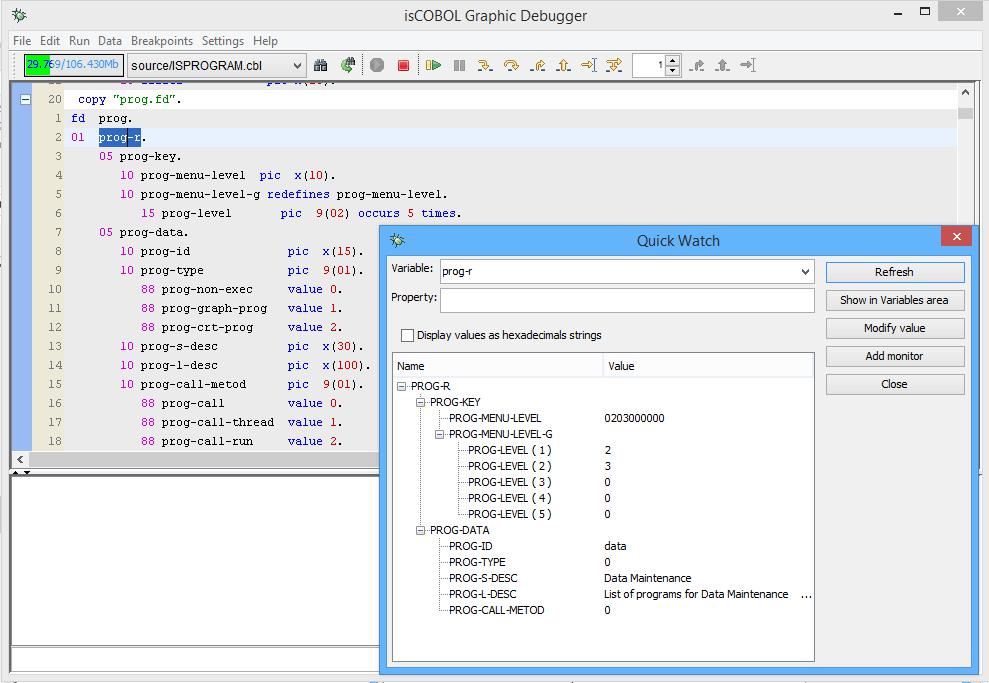
IsCOBOL Debugger offers the ability to show the program's variables in a 'tree structure'. This is very useful when you need to see the content of grouped variables (under 01 level) in Working-Storage or Linkage sections, or FD definitions, because you can immediately see the content of all child variables, including the occurs items.
This is done through Quick Watch function. This function is activated in one of the following ways:
- pressing Ctrl+Q on a selected variable,
- choosing the menu item 'Data - Quick watch' in the main window menu-bar,
- choosing the pop-up menu item 'Quick watch'.
See the image below
|
| Authored
by: Veryant Support
This question has been viewed 5283 times so far.
|
| Click
Here to View all the questions in Debugging
category. |
 File Attachments
 |
| There are no attachment file(s) related to this question. |
| |
 User Comments User Comments |
 |
|
| There are no user comments for this question. Be the first to post a comment. Click Here |
 Related Questions Related Questions
|
- How do I debug just one program in Application Server environment?
- How do I configure the debugger to find source code that is not in CLASSPATH?
- How do I specify isCOBOL, Java or application properties on the command line?
- Starting a new trace log file for the current run unit
- How to tell the Debugger to pause with a different key than the Pause key?
- Did you know you can see the content of variables while debugging?
|
 Contact