Running an application with isCOBOL Code Coverage from the command-line
In order to obtain an accurate report of the test coverage, the COBOL programs must be compiled with -g option.
Before running the application with isCOBOL Code Coverage, you should consider configuring the Coverage engine by setting one or more of the properties described in isCOBOL Code Coverage Configuration. For example, you can include only some of the programs in the test coverage by setting iscobol.coverage.analysis.includes or to exclude some of the programs by setting iscobol.coverage.analysis.excludes.
You may also specify the location of COBOL source files by setting iscobol.coverage.sourcefiles, as these files are searched in the current directory by default, but the current directory doesn’t usually match with any of the directories where source files are stored.
You can also create a folder to host the HTML report generated by the Coverage engine, and set iscobol.coverage.html to point to this folder. By default, the Coverage engine looks for a folder named "htmlReport" in the current directory. If the folder doesn’t exist, it is automatically created.
In order to run an application with isCOBOL Code Coverage, add the -coverage option to the runtime command line, e.g.
iscrun -coverage -c myApp.cfg ProgramName |
When the runtime session terminates, the folder pointed to by iscobol.coverage.html will include several files. Open "index.html" with your favorite web browser to see the isCOBOL Code Coverage report.
The home page of the report will look like this: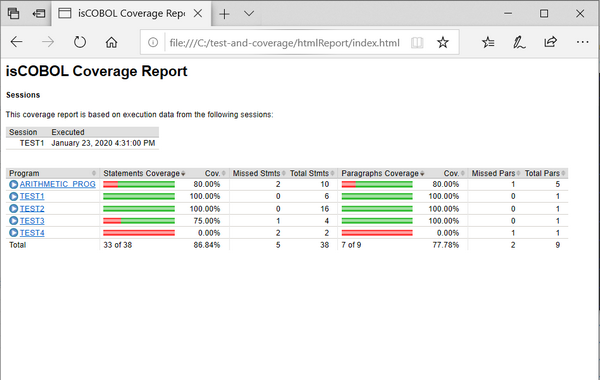
In the home page you see the list of involved COBOL classes. For each class, the following information is provided:
Column Name | Column Content |
|---|---|
Program | Class name stripped of the ".class" extension. |
Statements Coverage | Graphical representation of the amount of missed statements (red) and the amount of covered statements (green). |
Cov. | Percentage of covered statements over the total number of statements. |
Missed Stmts | Count of missed statements. |
Total Stmts | Total number of statements. |
Paragraphs Coverage | Graphical representation of the amount of missed paragraphs (red) and the amount of covered paragraphs (green). |
Cov. | Percentage of covered paragraphs over the total number of paragraphs. |
Missed Pars | Count of missed paragraphs. |
Total Pars | Total number of paragraphs. |
Clicking on the COBOL class name in the Program column brings you to a detailed analysis of the class activity: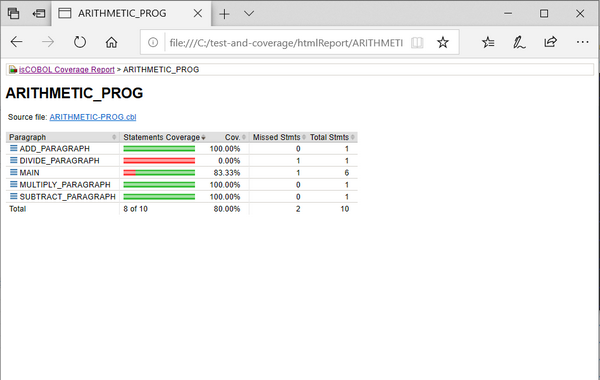
In this page, the following information is provided:
Column Name | Column Content |
|---|---|
Paragraph | Name of the paragraph. It is prefixed by the method name if the interested class is a CLASS-ID program. |
Statements Coverage | Graphical representation of the amount of missed statements (red) and the amount of covered statements (green). |
Cov. | Percentage of covered statements over the total number of statements. |
Missed | Count of missed statements. |
Stmt | Total number of statements. |
Clicking on the source file name above the table brings you to a detailed analysis of the source code, where you can see covered code with a green background and missed code with a red background: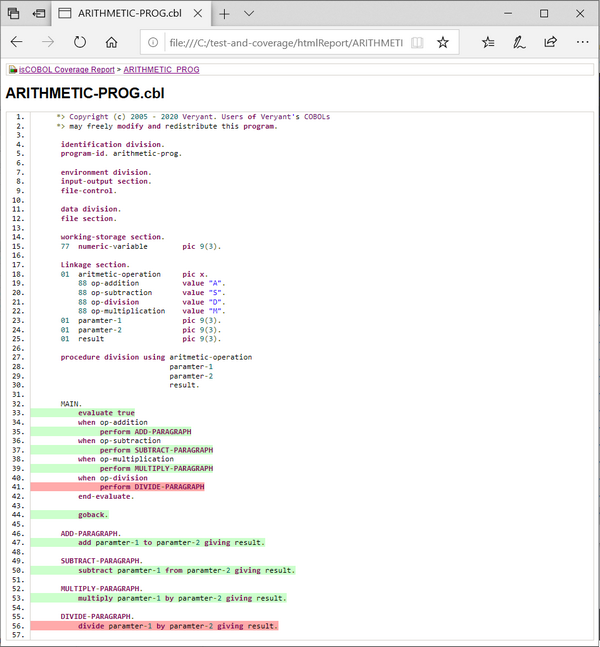
It’s also possible to obtain a coverage report in XML format.
Set iscobol.coverage.xml to the name of the XML file that you want to obtain.
The XML file content looks like this: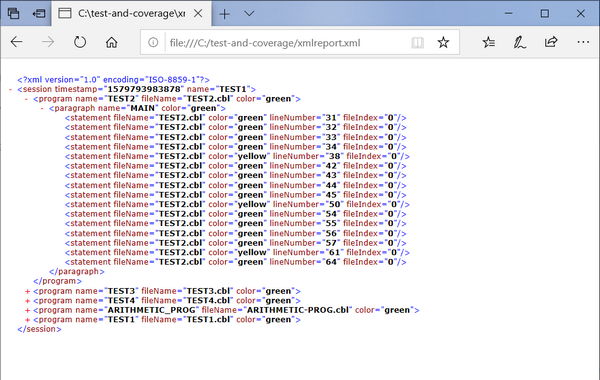
The main element is session and it includes one or more program element.
Every program element includes one or more paragraph elements.
Every paragraph element includes one or more statement element.
For each element, the color attribute specifies if the element was covered ('green') or not ('red'). The value 'yellow' indicates a statement that has multiple branches and that not all the branches in code have been reached (e.g. an IF statement).
If you set only one between iscobol.coverage.xml and iscobol.coverage.html, then only the report related to the property that you set is generated.
If you set both properties, then both reports are generated.
If you don't set any of these properties, then an HTML report is generated in the "./htmlReport" directory.
XML reports of multiple runtime sessions can be merged together by setting the iscobol.coverage.append configuration property.