Debugging
Before debugging, be sure that the programs are compiled either with the -d option or the -dx option.
One of these options should appear in Veryant > Compiler: Options in the settings.
To debug the current program click the Run and Debug button in the Activity Bar or press F5.
To run the whole application, set Veryant > Main: Program in the settings, then click the Run and Debug button in the Activity Bar or press F5.
The following debug actions are available:
Function | Button | Keyboard shortcut |
|---|---|---|
Continue |  | F5 |
Pause |  | F6 |
Step Over |  | F10 |
Step Into |  | F11 |
Step Out |  | Shift-F11 |
Restart |  | Ctrl-Shift-F5 |
Stop |  | Shift-F5 |
It’s possible to set breakpoints by clicking in the area before the line number or by pressing F9 when you’re positioned on the desired line. A breakpoint is represented with a red circle at the beginning of the line:

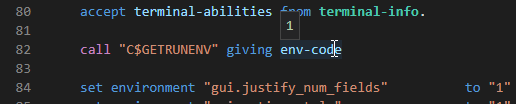
If you hover the mouse over a data-item name, the data-item content is shown in a tool-tip:
It’s possible to monitor the changes of the value of a data item by adding it to the Watched variariables list. To do so:
1. select the data item in the editor
2. right click with the mouse
3. choose "Add to Watch" from the context menu
The runtime configuration properties should be stored in one of the following files (if they exist):
Windows
1. \etc\iscobol.properties in the drive where the working directory is
2. C:\Users\<username>\iscobol.properties (the setup wizard saves licenses here, if you don’t skip activation)
3. iscobol.properties found in the Java Classpath (the output directory of the project is included in the Classpath)
4. a custom configuration file passed with the -c <configuration_file> option in Veryant > Runtime: Options
5. %ISCOBOL%\iscobol.properties
Unix/Linux
1. /etc/iscobol.properties
2. $HOME/iscobol.properties
3. iscobol.properties found in the Java Classpath (the output directory of the project is included in the Classpath)
4. a custom configuration file passed with the -c <configuration_file> option in Veryant > Runtime: Options
5. $ISCOBOL/iscobol.properties
NOTE - Files are listed in the order they’re processed. If the license key appears in more than one of the above files, then the last occurrence is considered.