Profiling COBOL programs
The isCOBOL Framework provides the ability to profile COBOL programs in order to identify which paragraphs or sections have used most of the CPU time.
Before profiling your programs, ensure that you already followed the suggestions from Compile-time optimizations and Better run time performance, e.g. programs are not compiled in debug mode and there is no logging of the runtime activity.
In order to profile the runtime activity, use the -profile option, e.g.
iscrun -profile IO_PERFORMANCE |
The above command starts the IO_PERFORMANCE sample installed with isCOBOL (it is located in the folder sample/io-performance of the isCOBOL SDK).
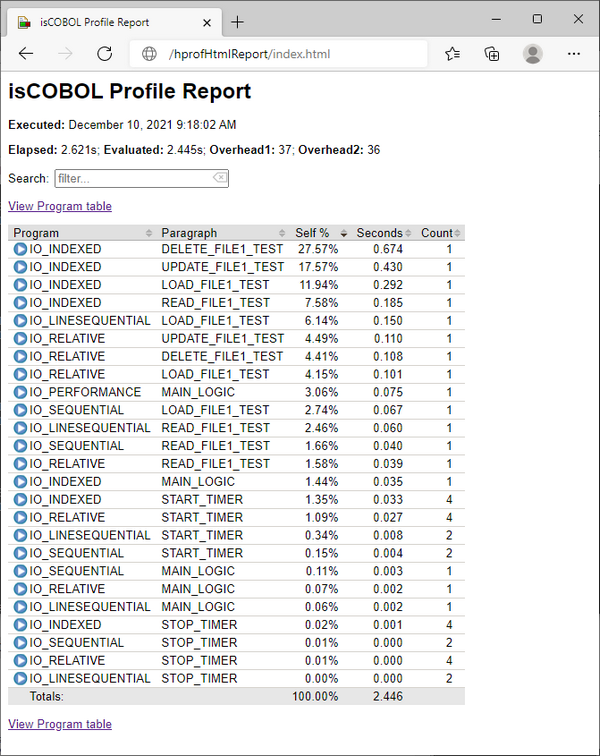
When the runtime session terminates, you will find a folder named hprofHtmlReport in the working directory. Open the file index.html in this folder using your favourite web browser to have a report of the profiled runtime activity.

At the top of the report, the following information is provided:
Info | Meaning |
|---|---|
Executed | Date and time the runtime session was executed. |
Elapsed | The real time passed between the profiler startup and the report generation. |
Evaluated | The time spent executing COBOL paragraphs. |
Overhead 1 | Estimated overhead in nanoseconds added by the profiler for each paragraph not containing PERFORM/CALL. |
Overhead 2 | Further estimated overhead in nanoseconds for each PERFORM/CALL. |
For each paragraph the following information is provided:
Info | Meaning |
|---|---|
Program | Program name. |
Paragraph | Paragraph/Section name. |
Self | Ratio between the time spent by the paragraph and the evaluated time . |
Seconds | Total number of seconds that this paragraph used while being executed one or more times in the runtime session. |
Count | Number of times the paragraph was executed. |
Paragraphs that used most of the time are on top of the list.
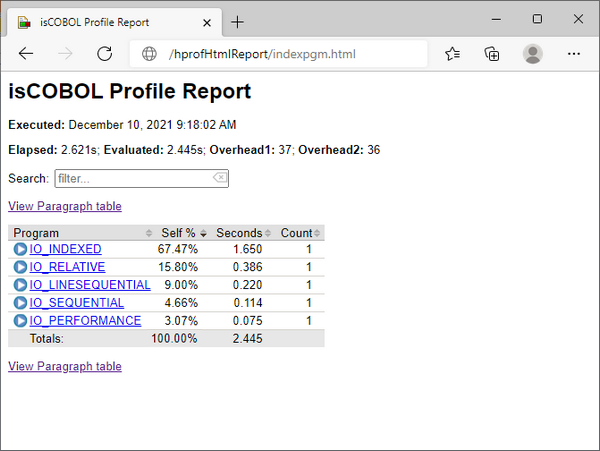
By clicking on "View Program table" you jump to a less detailed report where only programs are listed.

For each program the following information is provided:
Info | Meaning |
|---|---|
Program | Program name. |
Self | Ratio between the time spent by the program and the evaluated time. |
Seconds | Total number of seconds that this program used while being executed one or more times in the runtime session. |
Count | Number of times the program was executed. |
Programs that used most of the time are on top of the list.
The profile of a program execution is obtained by measuring the time spent in individual paragraphs (excluding the time spent in PERFORM/CALL) and by counting the number of times each paragraph is called.
The profiler adds an overhead that is roughly the same for each paragraph. This overhead is evaluated before the profiling and it is subtracted from the results. However the estimated overhead and the actual overhead can differ from time to time due to the machine status (multitasking, JIT compiler, etc).
If a paragraph has very few statements and it is executed many more times that the other paragraphs, the difference may be relevant and may affect the results accordingly.
The profile will include a row for each instance. That means if a program is called, cancelled then called again or if a program is called in thread, more instances of the same program will be profiled and it will appear multiple times in the profiler output.
Profiler configuration
The command iscrun -profile is influenced by the some configuration properties. See Profiler Configuration for details.
The javaagent option
The javaagent option allows you to customize the profiler behavior and activate the profiler where the -profiler option is not available, for example in application server environments or in WEB.
We advise using the -profile option rather than the -javaagent option whenever possible.
The command
iscrun -profile IO_PERFORMANCE |
is equivalent to:
iscrun -J-javaagent:/path/to/isprofiler.jar=profiler;html=hprofHtmlReport IO_PERFORMANCE |
Note - isprofiler.jar is located in the lib folder of the isCOBOL SDK.
The javaagent option allows you to specify some options to customize the profiler behavior and the resulting report. The syntax is:
-J-javaagent:/path/to/isprofiler.jar=[option1=value1;option2=value2;...;optionN=valueN] |
Where the available options are:
Option | Value |
|---|---|
excludes | List of programs that must not be analyzed by the profiler. Multiple values must be separated by comma. |
html | Pathname of a folder that will host a report in HTML format. |
includes | List of programs that must be analyzed by the profiler. Multiple values must be separated by comma. By default, all programs are analyzed. |
txt | Pathname of a report file in TXT format |
xml | Pathname of a report file in XML format |
Note - if neither html, nor txt, nor xml is specified, then no output is generated, unless you specify an output in the program via C$PROFILER routine.
For example, in order to profile the IO_PERFORMANCE program excluding the activity of the IO_INDEXED subprogram and generating a text report, you can run:
iscrun -J-javaagent:/path/to/isprofiler.jar=excludes=IO_INDEXED;txt=hprof.txt IO_PERFORMANCE |
The C$PROFILER library routine
Another way to customize the profiler behavior and the report files is by calling the C$PROFILER library routine. The routine is even more powerful than the javaagent option because it allows you to choose when the data gathered by the profiler should be flushed to disc (see CPROF-FLUSH) and it allows you to choose the blocks of code that must be profiled with a deeper precision than the includes and excludes options (see CPROF-DISABLE and CPROF-ENABLE).
Profiling programs in the IDE
The following Run Configurations allow to activate the profiler:
• isCOBOL Application
• isCOBOL Unit Test
In order to access these Run Configurations, click on Run in the menu bar and choose Run Configurations....
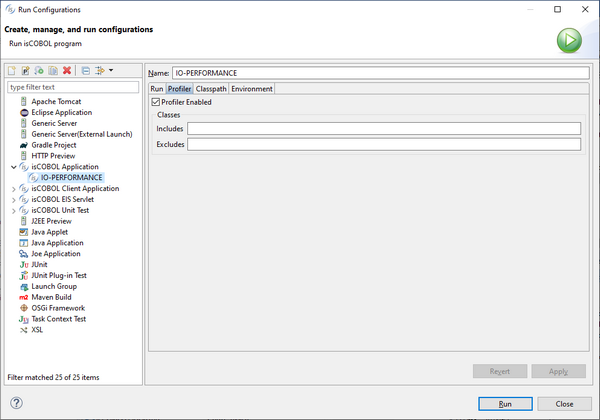
Switch to the Profiler tab, enable the option Profiler Enabled and optionally provide the list of programs to include in (or exclude from) the analysys.
This is an example of an isCOBOL Application configured to run with profiler:

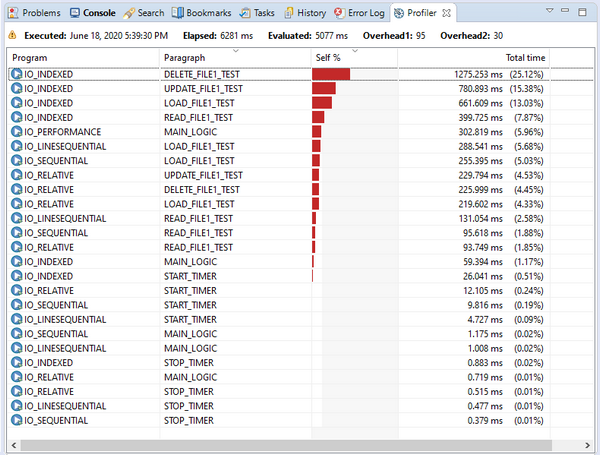
Click on the Run button to run the program. After the program terminates, the Profiler view will appear to show the profiler report:

Note - from now on, each time you run this program with the command Run As > isCOBOL Application, the profiler will be enabled. If you don’t need it anymore, access to Run Configurations again and disable the option Profiler Enabled.
Good practice for an accurate profiling
It’s good practice to profile only back-end programs, if possible. Profiling an interactive program may produce an unreliable report as the time spent by the user while interacting with the program is taken into account as well by the isCOBOL profiler.
If the COBOL application consists of a set of programs that manage the UI and a set of programs that perform processing, then you should consider profiling only the second set of programs.
This may not always be an option, in which case you can add calls to the C$PROFILER library routine to your programs in order to mark the parts of code that should be profiled. Call the CPROF-ENABLE function before the block of code that you wish to profile and call the CPROF-DISABLE function after that block of code.
Thin client
In a thin client environment it is possible to profile the application server (isCOBOL Server) activity by starting the server process with the same -javaagent option used for the runtime. E.g.:
iscserver -J-javaagent:/path/to/isprofiler.jar[=options] |
The profiling output is shown when the whole application server is terminated or when the CPROF-FLUSH function of C$PROFILER is called, and includes the profiling of all clients activities mixed together. Therefore, if you need to profile some programs in a thin client environment you should use a dedicated application server with only one client connected.
Tomcat and other application servers
In an application server environment like Tomcat it is possible to profile the programs’ activity by starting the server process with the same -javaagent option used for the runtime. Add the following Java option to the startup options of your application server.:
-javaagent:/path/to/isprofiler.jar[=options] |
The profiling output is shown when the whole application server is terminated or when the CPROF-FLUSH function of C$PROFILER is called, and it includes the profiling of all clients activities mixed together, therefore, if you need to profile some programs in an application server environment, you should use a dedicated application server with only one client connected.
Using Profiler and Code Coverage together
The isprofiler.jar agent implements both the Code Coverage and the Profiler tools. See Using Code Coverage and Profiler together for information on how to use them together.